Web Interface
BitMeters Web Interface allows you to monitor you connection speed remotely, via an ordinary web browser. The interface has been tested on Internet Explorer 6.0 and Firefox 1.0.7, although it is likely to work on most modern browsers. The web interface relies heavily on JavaScript, which therefore must be enabled on all clients.
The Web Interface is disabled by default - to enable it, tick the 'Run Web Server' box on the Settings Screen, and then click 'OK'. Any firewall software that is active on the machine running BitMeter must be configured to allow incoming connection requests to the TCP port specified in the Settings (by default BitMeter uses port 80).
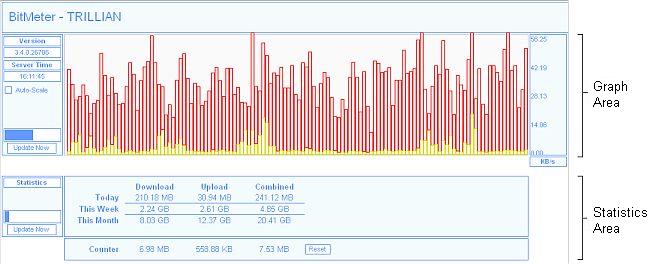
The Web Interface is divided into 2 main sections. The Graph Area of the screen represents the same information as the main BitMeter window - a graph showing upload and download speeds, which updates at regular intervals scrolling to the left. The Statistics Area shows a summary of connection usage, similar to that shown on the Summary Tab of the Statistics Grid screen

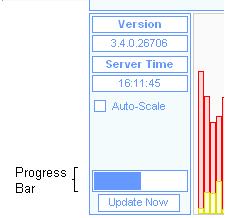
The sidebar to the left of the Graph Area shows various pieces of information such as the software version, and time of last update. In addition a Progress Bar is displayed, showing the time until the next update (the interval between updates is configurable via the Graph Refresh option on the Settings Screen). Clicking the Update Now button will force an immediate update.

The Auto-Scale option, also contained in the sidebar, determines whether the vertical scale of the graph changes according to the current speed, or stays fixed. If Auto-Scale is disabled, then the scale of the graph is the same as that entered in the Settings Screen.
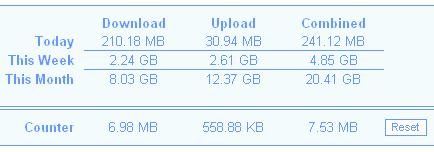
The Statistics Area displays the Download, Upload and Combined totals for the current day, week and month, as shown:

The Counter figures act as a running total of the data received since the web interface was loaded, and are updated each time new data is received. The Counter totals can be reset to zero by clicking on the Reset button.