Codebox Software
Gas Giant Infographics
Published:
This Python script generates infographic posters that visualise data about the outer planets in our solar system. You can find some pre-generated diagrams in the GitHub repository for this project.


The script has been written using Python 3, and has no external dependencies. To generate the diagrams just run the go.sh script from the root of the project:
./go.sh
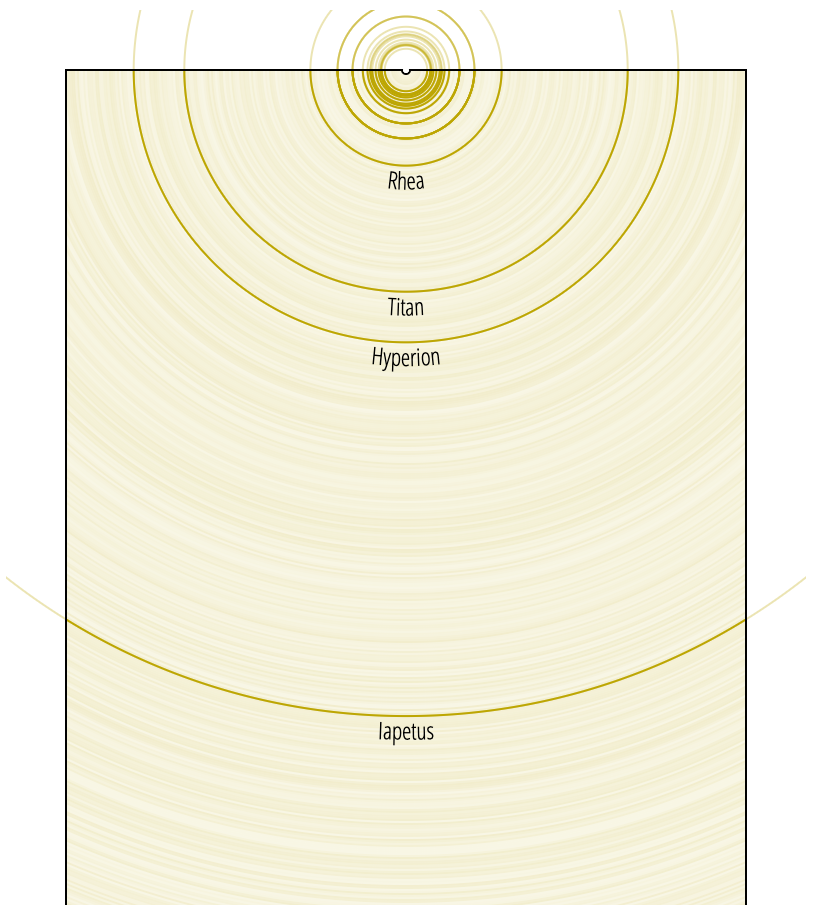
The left-most section of each diagram shows the relative sizes of the orbits of each planet's moons:
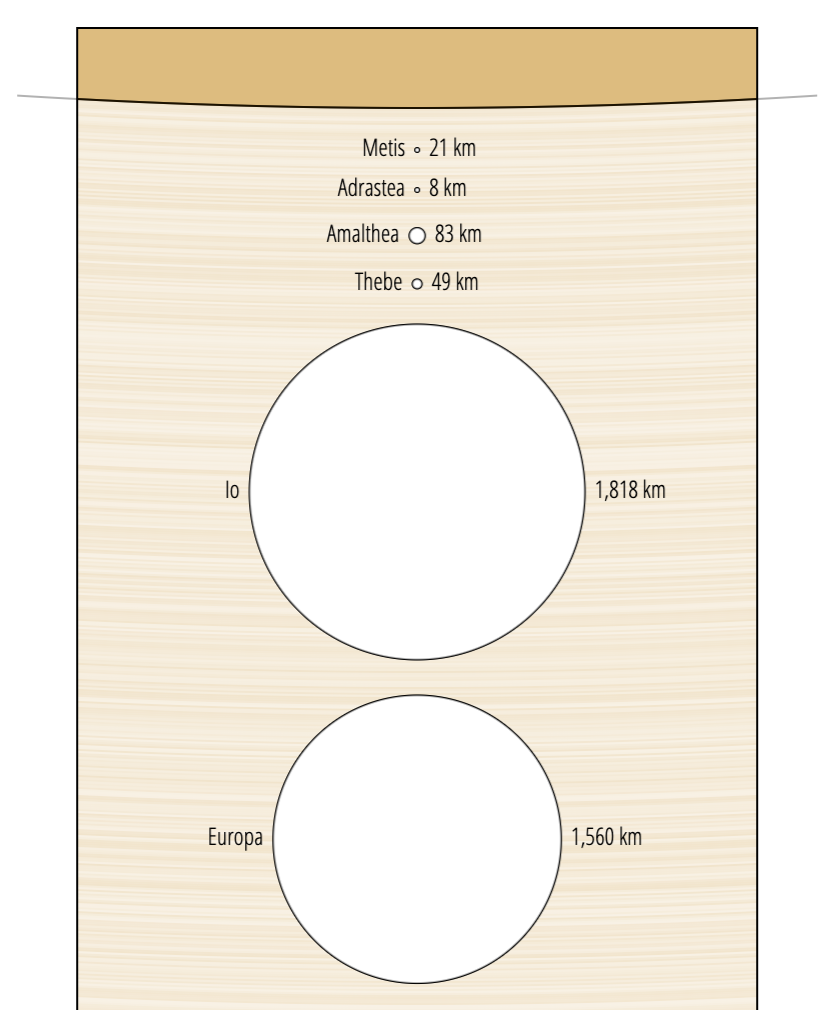
The right-most section shows the relative sizes of the moons themselves, with the radius of each shown in kilometers. At the top of this section the diagram shows a small part of the parent planet drawn at the same scale:
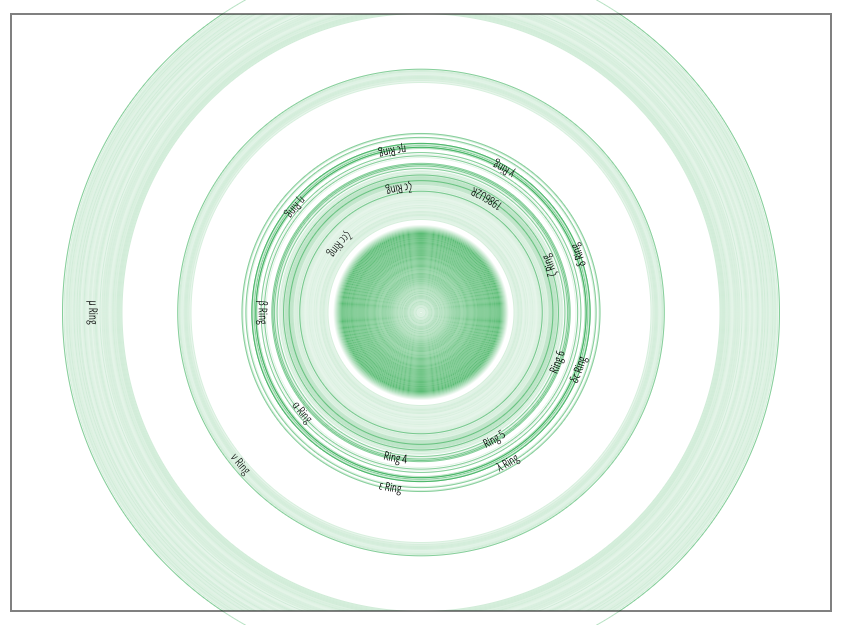
Each planet's ring system is illustrated in the top center section, with the planet's disc shown for scale:
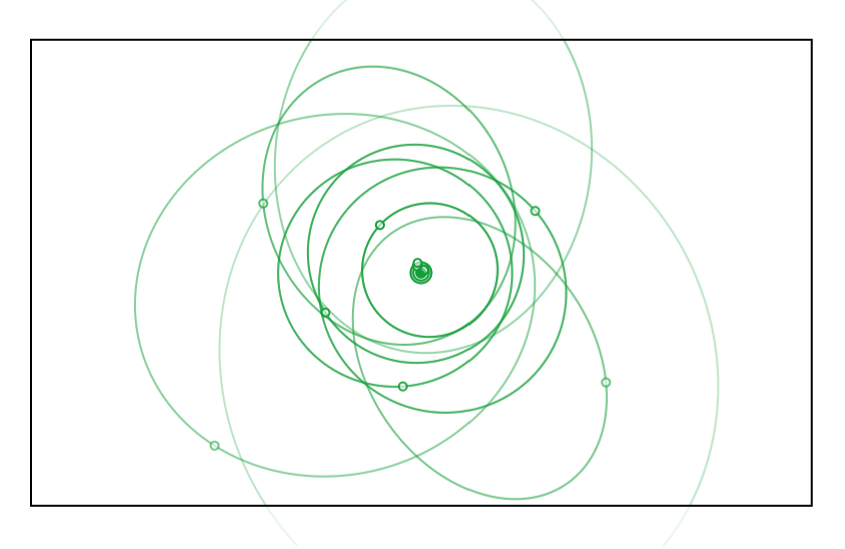
The orbital paths of all the moons are shown in the center-right section, illustrating the size, shape and orientation of each:
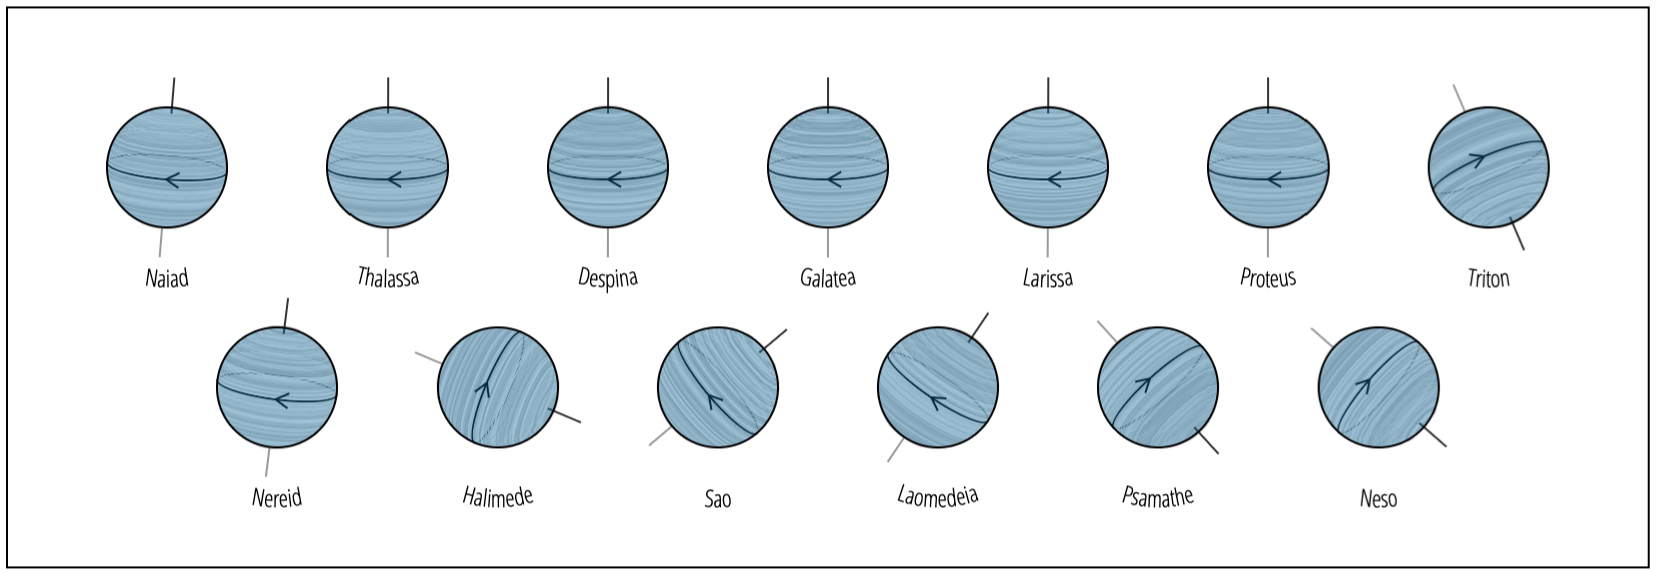
The rotational axis of each moon is shown in the bottom-center section:
The source code is released under the MIT open source license and is available on GitHub.